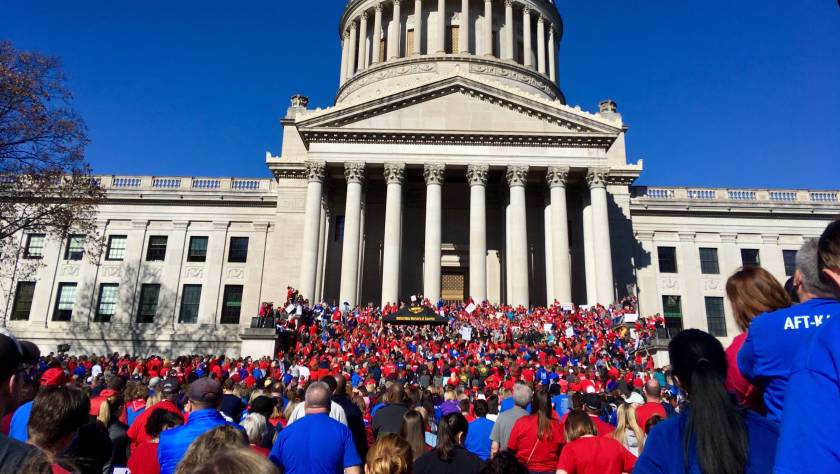
On February 22nd West Virginia public school teachers went on a wildcat strike for raises and maintaining their health benefits.(Elk 2018b) The strike lasted 9 school days and ended up with the all school employees winning a 5% raise.(Associated Press 2018) The victory of West Virginia teachers inspired teachers in states like Oklahoma and Arizona. In Oklahoma, the teachers went on strike on April 2nd even though they had received a $6,000 raise just days before. They demanded a $10,000 raise and more funding for their schools.(Elk 2018a) In Kentucky, teachers called a sickout on March 30th then rallied to the state capitol on April 2nd as Kentucky governor vetoed a bill that would increase per pupil funding the week before(McLaren and Costello 2018). He also signed a pension reform bill in February that was widely unpopular with the teachers as it made teacher pensions more like 401(k) plans. The wave of strikes eventually spread to blue states in Denver, Chicago, Oakland and LA (DiMaggio and DeManuelle-Hall 2019).
In the light of the new wave of teacher strikes, I aim to provide a theoretical understanding of the decline in the state of public education and teachers’ work standards to explain the current wave of radicalization among teachers. To do this, I will attempt to provide a basic theoretical groundwork for understanding the state actors, capitalist crises and their relation to the state, as well as the state’s role in determining the quality and the quantity of public services. In capitalist economies, the state is responsible for a variety of tasks that include providing infrastructure individual capitalists cannot develop on their own, legitimizing the existing relations of production and reproducing the capitalist social relations through reinforcing property relations. These tasks are performed by various branches of the government, and institutions that are run by these branches. Through class struggle, workers can influence state policies and increase the state’s influence in the economy. However, this rarely happens on the terms of the workers. The expansion of public education has been a result of many struggles; but too often, as struggles die out, the gains that came through them began to be undermined by dynamics of capital accumulation. Class struggle is one of the many factors that influence state policies. But even then, the main determinants of state policies remain to be the necessities of maintaining a level of capitalist production and the capitalist social order. Only through obstructing the reproduction of capitalism can the workers gain concessions from the state.
In the first section of this paper I will provide an overview of state theory and discuss the constraints under which the state actors come up with policies. Second section will focus on aggregate profitability as a factor that determines the actions of capitalists and state actors alike. It will also discuss the origins of neoliberalism and how it shaped the policies that followed the Great Recession. Third section will elaborate the influence of structural constraints on the actions of state actors through showing empirically which actions or inactions have led to the decline in the quality of education and teachers’ pay. It will give an overview of state and financing of education, taxation, and spending. Finally, the last section will look at the history of teacher strikes and their relationship to the state. I will conclude by summarizing the relationship between the state, profitability and teacher strikes in the public sector.
The State
To explain the current crisis in public schools, we need a better understanding of the relationship between the state actors and the capitalist class. Historically, the state is capitalist due to the nature of its development, but its actions often contradict the interests of the capitalist class. There are four major theories of the capitalist state that try to explain the contradiction between the state’s capitalist nature and pro-worker reforms sometimes pursued by the state in the past.
First is the ‘instrumentalist’ view which argues that the state is the instrument of a class-conscious vanguard of the capitalist class. This view stems from the earlier and more polemical works of Marx and was prominent among second and third international Marxists (Miliband 1969). In the Communist Manifesto, Marx claims “The executive of the modern state is but a committee for managing the common affairs of the whole bourgeoisie” (Marx 1888) Today, even among Marxists this view is hard to maintain uncritically, given that the state provides many material benefits to the working class today.
One of the more recent iterations of this view that aims to grapple with this contradiction comes from the scholars of ‘corporate liberalism’ (Skocpol 2016). These writers argue that the New Deal was the consequence of a conscious pursuit of long-term interests among the vanguard of the capitalist class. For this view to hold, however, there must be a class-conscious vanguard of the capitalist class, who can pursue both the short-term and the long-term interests of the capitalist class. Skocpol argues that this was simply not true at the time, as most capitalists were in intense competition with one another (Ibid: 164) The intense and continuous competition between capitalists contradicts the main premises of this view.
The second view is the ‘structural functionalist’ view. Proponents of this view argue that state’s objective function is to maintain continuous reproduction of capitalism (Poulantzas 1969). Hence, the capitalist class does not need to exert direct pressure on the state for the state to pursue pro-capitalist policies. As a result, the state has relative autonomy from the capitalist class, which enables it to pursue policies that might contradict the short-term interests of an individual capitalist, but also enables the reproduction of capitalism in the long run. This account suggests that it is not the vanguard of the capitalist class, but the state that is conscious of the long-term interests of the capitalist class. Functionalists run into a similar problem as the instrumentalists by assuming the state, instead of the vanguard of the capitalist class, is conscious of the long-term policies required for capitalist social reproduction. In this scenario, however, if individual capitalists become conscious of their own long-run interest, and their interests are contradicted by the state policies, then the relative autonomy of the state would be very limited since capitalists would try to exert direct pressure on the state (Block 1987: 53). Hence, much like the first view the dynamics of competition would overwhelm a coherent unified long-term strategy.
The third view is the ‘state autonomist’ view which proposes that the state has complete, or near-complete, autonomy from class relations, and this autonomy enables it to shape class relations. The main limitations on the state are those imposed by “national administrative arrangements, governmental institutions, and political parties” (Skocpol 2016: 201). The policies are neither determined by capitalists, nor by the workers. They are determined by the state managers, whose insulated social status enables them to shape the terrain of conflict between workers and capitalists. Skocpol, for example argues that it was the legalization of the right to collective bargain that caused the mass wave of unionizations in 1933-35. This view however undermines the agency of the working class by assuming the working class’s relationship to the state is what determines its willingness to engage in class struggle.[1]
As much as the particularities of state policy are determined by those who actually pass the legislation, the horizons of the policies the state managers are shaped by the balance of class forces.
Finally, the fourth view is what I will refer to as the ‘class struggle’ view, which is the view that will be explored most in depth as it appears the most applicable for the purposes of this paper. The foundations of this view are developed by Fred Block in the Ruling Class Does Not Rule (Block 1987). For Block, while capitalists are conscious of their (short term) interests, they are not fully conscious of what is necessary to reproduce the existing (political and economic) social order. State actors, on the other hand, are forced to figure out how to reproduce the existing social order. Hence, Block agrees with Poulantzas that the managers of the state have a broader understanding of society than the capitalists, but he contends that their understanding is still short of a complete knowledge of the necessities of reproducing the existing order. One factor of this lack of understanding on the part of the state managers could be their struggle to maintain political power and the distortions this causes in their understanding. For example, state actors often must react to immediate crises to remain in power but sometimes their reactions might lead to bigger crises and disrupt the reproduction of the social order. But if neither the ruling class nor its representatives have a complete understanding of the necessities of preserving and reproducing capitalist social relations then how does the state manage to do just that? Block claims that there are two subsidiary structural mechanisms and two major structural mechanisms that force the state actors to act in the general interests of the capitalists and preserve capitalist social relations.
The first subsidiary mechanism is the direct ways by which the bourgeois influences the state apparatus. Since we have established that capitalists are at least aware of their short-term interests, they are also aware of the impact the state apparatus has on those interests. Thus, capitalists act to put pressure on the state, in pursuit of their interests, through direct means such as campaign contributions, lobbying activities and favors to politicians and civil servants. Oftentimes, capitalists will actively participate in private policy making groups that have powerful impact on formulation of government policies, although these are likely to diverge from the unengaged ruling class opinion. But even in the instances where members of the ruling class do not directly engage in these groups, those from other classes fill this role as their representatives. An example to this mechanism can be seen in the charter school movement, where the likes of Bill & Melinda Gates Foundation, Chan Zuckerberg Initiative and the Walton Family have campaigned for privately run public schools (Charter School Growth Fund 2017b).
The second subsidiary mechanism is bourgeois cultural hegemony. Block states that there are written and unwritten rules about what constitutes legitimate state policy. An example to this could be the neoliberal ideology that has been, and still is hegemonic among the ruling class and state actors. Neoliberalism promotes austerity, tax cuts and financial deregulation. Neoliberal hegemony provided a framework for many states and counties to underfund their public schools as we will see in the following sections. Those that oppose the neoliberal consensus on these policies have often been marginalized within the state apparatus.
The first major structural mechanism can be derived from the fact that all state actors need to maintain some degree of economic activity to be able to maintain their own power regardless of their political ideology. Firstly, because the financing of the state apparatus is dependent on its tax revenues and borrowing, both of which depend on the state of the economy. And secondly, public support for a regime will decline sharply in the instances of high unemployment, low economic activity, and a shortage of key goods. Even if public support is not significantly affected, it will make it more challenging for state actors to maneuver other challenges and take effective actions.
The level of economic activity depends on private investment decisions made by individual capitalists. Block states that this means that capitalists, as investors, can essentially veto state policies since reducing their private investments can cause major political crises for state managers. This discourages state managers from pursuing policies that might decrease the rate of investment. In fact, the investment-veto capitalists hold encourages state managers to pursue policies that would increase private investments. This makes it more likely for the state actors to act in the interest of capitalists. As we will see later, many states have reduced their tax rates to increase private investments following the Great Recession.
In short, the state needs to maintain a level of ‘business confidence’. Capitalists decide on their level of investment based on such economic factors as wages, tax rates, market size but also non-economic factors such as the type of government, political stability. If capitalists believe that the tax rates are about to increase, they could threaten state managers with reducing their rate of investment. Or, if they believe that state managers are going to violate fundamental rules of the market, capitalists could move their investments to different places where they can invest more freely. The key point here is that ‘business confidence’ reflects the short-term interests of the capitalists and the influence of their interests on the actions of state managers. As a result, even when there is no direct pressure from capitalists, the state actors need to maintain a degree of business confidence to maintain their own social power and the state apparatus.
Yet one question remains: The state actions and policies that attempt to maintain and increase business confidence often require an increase in the role of the state in the economy. Why would capitalists give more power to state managers? This is a result of our second major structural mechanism that determines the actions of state managers, class struggle.
Class struggle broadly has two main effects in determining capitalist development and political-economic relations. First, through the struggle for higher wages, class struggle pushes capitalists to develop the forces of production to replace workers with machines and make production more ‘efficient’. Second, through the struggle for improving living and working conditions often requires the state to act. In the struggles to improve working and living conditions, the working class has played an important role in the increased role of the state in capitalist countries. These struggles pressured the state into imposing more regulations and providing more services for working class people. Yet capitalists have also supported increased state regulation, if not state spending, in cases where it would hurt their competitors or to get government contracts. But the major factor in the growth of state intervention in the economy has been working class struggle and the pursuit of state managers to gain more power.
This is where we encounter the development of public education. Block states that “workers have played an important role, for example, in demanding increased public education” (Block 1987: 64) A glimpse at the history of public education in the United States reveals that periods of its development and spread coincide with periods of high levels of class struggle in the 1930s and 1960s. Within these periods strikes and social movements were widespread. The expansion of public education, in return, helped create an educated labor force that capitalist development required but without class struggle the conditions under which public education expanded would be undoubtably different.
Although working class struggles can lead to an increase in state regulation and services, we must not lose sight of the constraints under which the state apparatus functions. Block states that; “working-class pressures, for example, might lead to an expansion on educational resources available for the working class, but there is every likelihood that the content of the education will be geared to the needs of accumulation – the production of a docile workforce at an appropriate level of skill” (Ibid). Oftentimes, after a working-class victory in one of these struggles, the capitalist class will attempt to neutralize or destroy the gains through its influence on the state apparatus, or the state managers might have to undo certain regulations or cut spending during times of crisis. We have seen these types of policies take place under neoliberal hegemony. Block states three main factors that state managers must weigh at the times of popular struggles. First, the state managers do not want to hurt business confidence. Second, they do not want to escalate class conflicts to a level that would threaten their own rule. And third, they are aware that the expanded role of the state will also grow their own power and resources.
To summarize this section, we have established that the capitalist class lacks the class consciousness to influence the state in a unified manner and that there is a division of labor between the capitalist class and its representatives in the state. Yet, the state still acts in the interests of the capitalist class due to direct coercion, capitalist cultural hegemony and its dependence on the level of investment capitalists provide. We have also established that class struggle determines the actions and the development of the state apparatus, but these remain within the confines of ; (1) maintaining “business confidence”, (2) the state managers’ interest in increasing their own power and resources, and (3) lowering the level of class antagonisms to maintain political stability. In relation to public education, we have stated that its growth had been influenced by class struggle but also within the confines of the capitalist interests and the interests of the state actors. Next sections will analyze the economics the Great Recession, the state reaction against it, provide empirical evidence to support some of the theses from this section and look at labor relations in public education,.
The Crisis
There is evidence of teachers’ salaries eroding at least since the late 1960s.(Allegretto, Corcoran, and Mishel 2008) Although the current crisis of public education is mostly a result of the Great Recession and the policies that followed it, similar trends can be observed during past recessions as well. Therefore, to understand these policies, we should have a more in depth look at what dynamics caused the Great Recession and economic crises in general.
There are many theories that attempt to explain the dynamics of the Great Recession. The most mainstream theories tend to assume that capitalism is capable of continuously creating economic growth. Hence, most recessions are either explained by shocks that are ‘exogeneous’ to the system, or by business cycle ‘adjustments’ (Shaikh 1978). More ‘heterodox’ theories emphasize the growth of the financial sector and instability created by increased financialization. (Minsky 1992, Stiglitz 2015). However, in economics rarely are recessions considered in the context of the long-term development of capitalism. This, in turn, often leads to misleading conclusions about what happened and what is to be done next.
In the First Great Depression of the 21st century, Anwar Shaikh tries to explain the causes of the Great Recession with the long-term movements in the profit rate of enterprise. The profit rate of enterprise, in Shaikh’s essay, refers to the difference between the rate of profit and the interest rate. Shaikh explains the enterprise rate of profit in the following way:
The classical economists argued that it is the difference between the profit rate (r) and the interest rate (i) which is central to accumulation. The reason is that profit is the return to active investment, while the interest rate is the return to passive investment. A given amount of capital may be invested in producing or selling commodities, in lending money, or in active speculation. The rate of profit in each case is its return, fraught with all the risks, uncertainties and errors to which such endeavors are subject. … On the other hand, the same amount of capital could just as well be invested in a savings account or a safe bond, earning interest in quiet and relative safety. The interest rate is the benchmark, the safe alternative, to the rate of return on active investment. (Shaikh 2011)
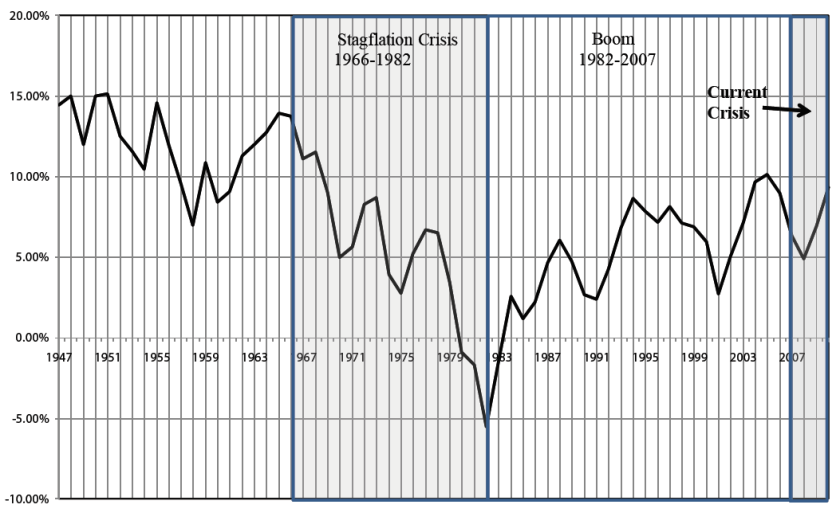
Through observing the movements in this rate, Shaikh also elaborates how a similar trend to the Great Recession played out in the great stagflation crisis of the 1970s. In Figure 1, Shaikh displays the changes in the rate of profit before interest.
Figure 1: Actual and Trend Rate of Profit, US Nonfinancial Corporations 1947-2010
Profit = Earnings Before Interest and Tax

Source: Shaikh(2011)
As we can see the rate of profit before interest started declining in mid-1960s but stabilized after the 1970s. Shaikh explains this stabilization through two factors. The first factor is an increase in exploitation. This means that workers became more productive but this increase in their productivity was not reflected on their income. Figure 2 shows the growing gap between income and productivity starting in 1982. In the case of teachers, this change will be reflected in a slow decline in pupil per teacher ratio combined with a much sharper decline in teacher incomes as we will see in the next section.
Figure 2: Hourly Real Wages and Productivity, US Business Sector 1947-2010(1992 = 100)
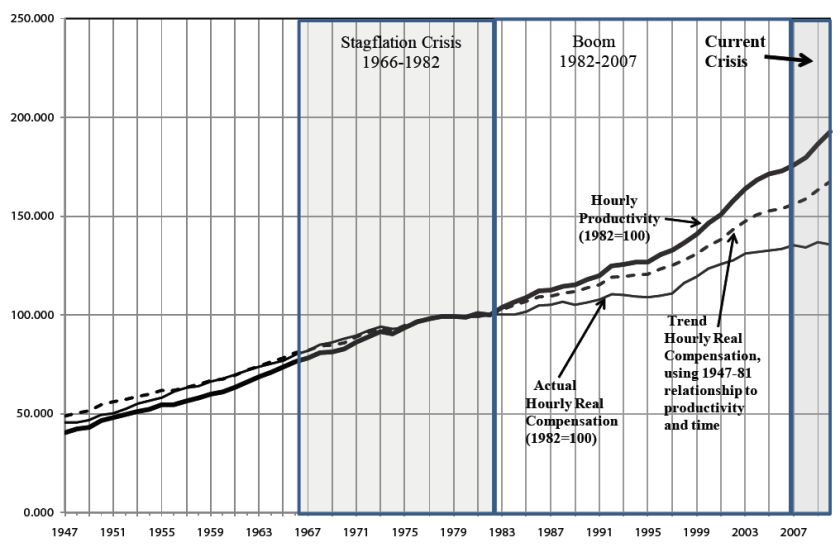
Source:Shaikh(2011)
In Figure 2, Shaikh shows that if the relationship between real wages and productivity continued at the same pace as the pre-1982 period, the gap between wages and productivity would have been much lower. Shaikh credits the post-1982 trend on concerted attacks on labor in this period by capitalists and claims that this has helped the profit rate recover. In Figure 3, we can see the existing and counterfactual trends in the profit rate for if the wages had kept up with the increases in productivity.
Figure 3: Actual and Counterfactual Rate of Profit of US Nonfinancial Corporations 1947-2009(Counterfactual path if real wages had continued on their postwar trend)
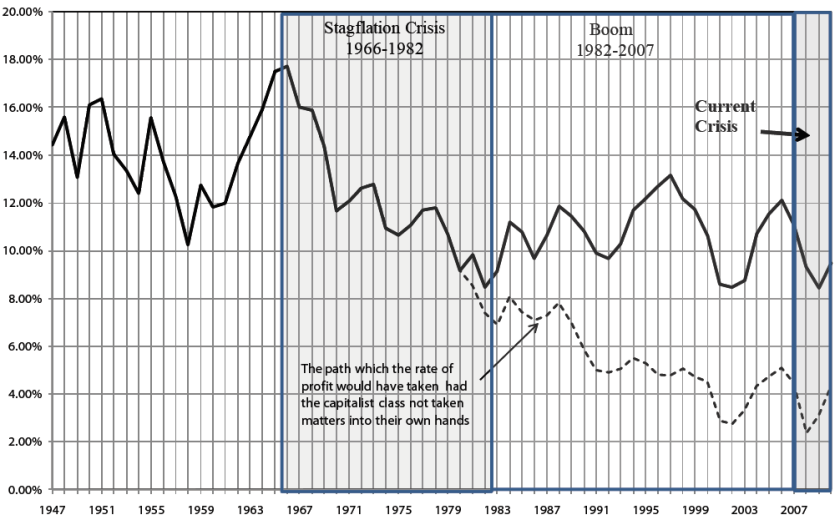
Source:Shaikh(2011)
As we can see, the capitalist attacks on labor helped the rate of profit stabilize to some extent since the 1980s. The second factor that stabilized profitability was the interest rate. Since profit rate of enterprise is defined to be the difference between the profit rate and the interest rate, the changes in interest rate influences investment decisions significantly. Figure 4 shows the long-term trends in the interest rate.
Figure 4: The Rate of Interest (3 Mo. T-Bill), US 1947-2008
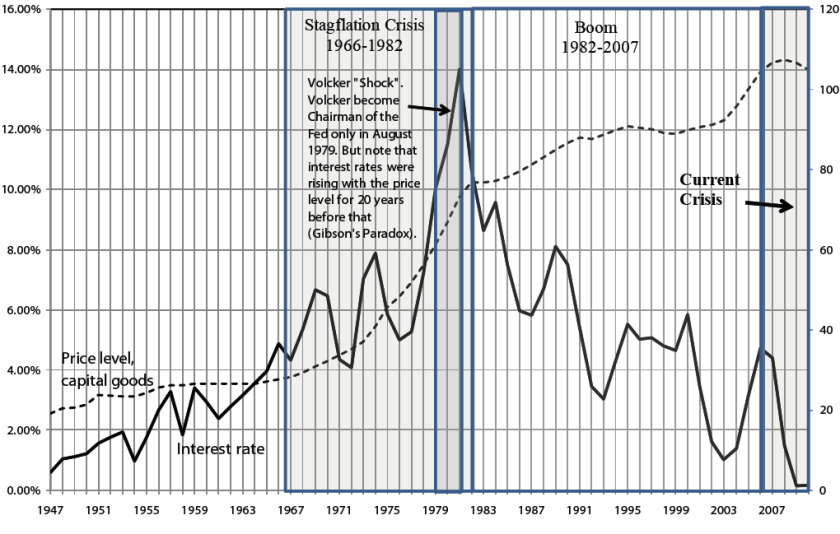
Source:Shaikh(2011)
From 1947 to 1981, the interest rate increased from 0.59% to 14.03%. After 1981, it had dropped just as drastically to 0.16% in 2009. Figure 5 shows the combined effects of the drop of the interest rate and the increase in exploitation. These two factors help explain the recovery from the stagflation crisis and the long boom that lasted until the 2009 crisis.
Figure 5: Rate of Profit-of-Enterprise: US Nonfinancial Corporations, 1947-2008
Source: Shaikh(2011)
As we can see in Figure 5, the profit rate of enterprise recovered from 1982 until 2009, although still having two downturns which coincide with the two recessions that happened in the late 1980s and early 2000s. Shaikh’s theory also explains why the boom that took place since 1982 was inherently contradictory. As work became more exploitative and interest rates went down, household debts increased significantly. Figure 6 shows the increase in debt to income ratio for the given period.
Figure 6: Household Debt-to-Income Ratio
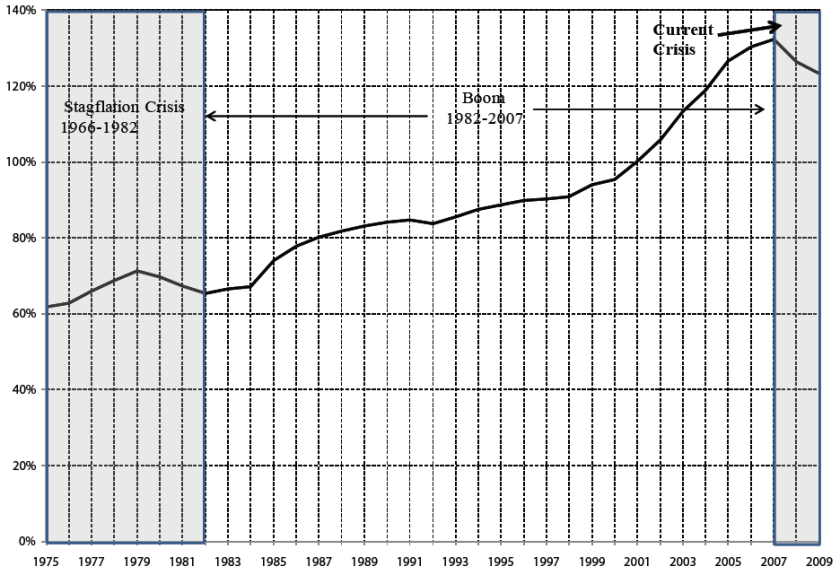
Source: Shaikh(2011)
As household debt soared and wages stagnated, people could no longer pay back their debt, and this has led to a drop in the rate of profit of enterprise and triggered the Great Recession. The main takeaway from this section is the relationship between the previously mentioned “business confidence”, the rate of profit and its effects on working-class people when the level of class struggle is low. As the rate of profit declined in the 1970s, state actors and capitalists alike were forced to act to recover profitability. They did this through concerted attacks on labor, deunionization and changes in the labor law. Figures 7 and 8 show the sharp decline in rates of union membership and ratio of workers represented by unions since the 1980s.
Figure 7: Percent of employed, Members of unions
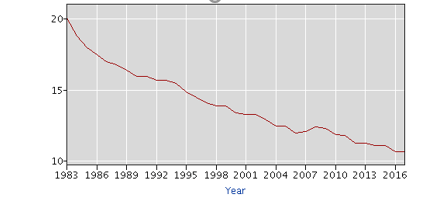
Source: BLS
Figure 8: Percent of employed, Represented by unions

Source:BLS
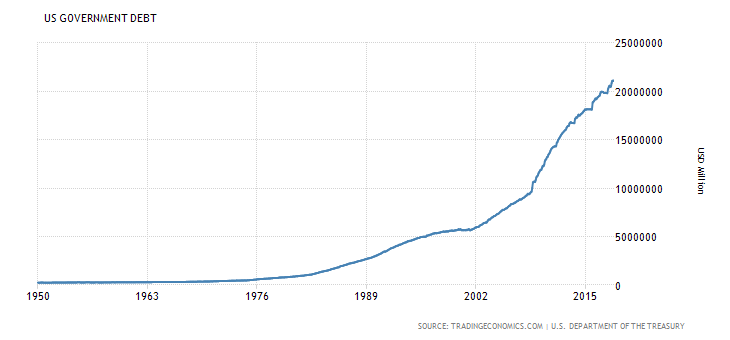
One policy Shaikh does not mention is the complete reconstruction of the US tax code and the rhetoric of taxation in the 1980s. In 1981, US top individual income tax rates dropped from 70% to 50%. By the end of the 1980s this rate dropped to 33% (Frankel 2017c). For our purposes, as it will be discussed in the next section, federal income taxes are not the most relevant factor in public education, but it is important to understand the shift in tax policies, their impact on what constitutes a ‘legitimate policy’, and how states followed suit with the federal government which led to similar consequences at the times of crisis. Tax cuts have been one of the main policies the state actors used to promote ‘business confidence’ in the last few decades. As a result of this, federal corporate income tax rates have also been lowered in the last few decades as Figure 9 shows (Trading Economics 2020a). As the federal government has been cutting taxes consistently, public debt has soared and became a large justification for austerity. Figure 10 shows the increase in US government debt since the 1950s (Trading Economics 2020b).
Figure 9:US Federal Corporate Tax Rate

Figure 10: US Government Debt
The next section will discuss the general state of public education in the United States and what has led to the current crisis will be explained in the context of concepts explored. The final section will look at the crisis from the point of view of the teachers and their relationship to the public education system.
The State of Public Education
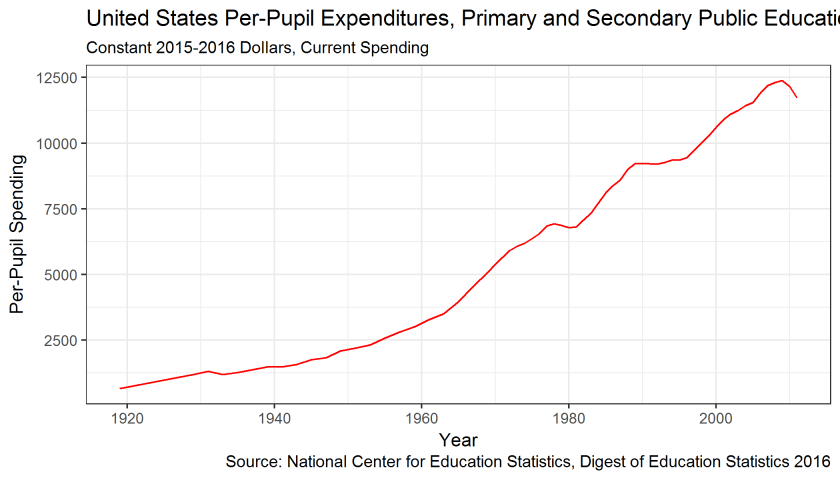
It is quite easy to paint various pictures about the state of public education in the US based on available data. For example, we can see in Figure 11 that the United States is among the countries that have the highest per pupil spending on education (OECD 2019). Or we could observe in Figure 12 that the per pupil spending in the United States had been increasing consistently for most of the last century (NEA 2016).
Figure 11: Primary to Post Secondary per pupil spending
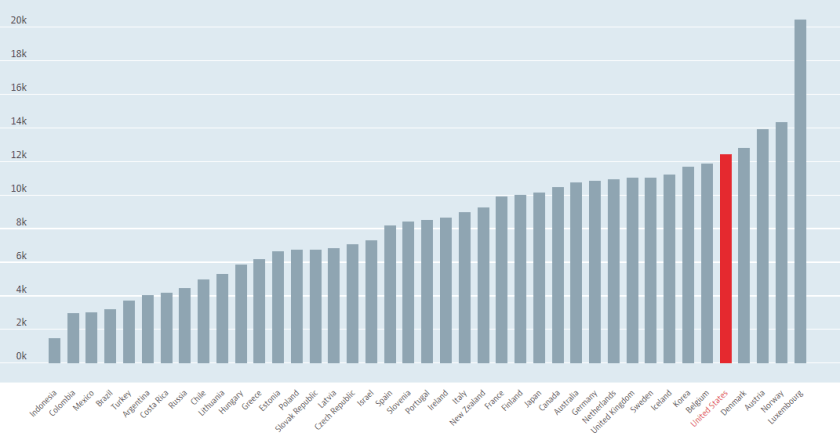 Source: OECD
Figure 12
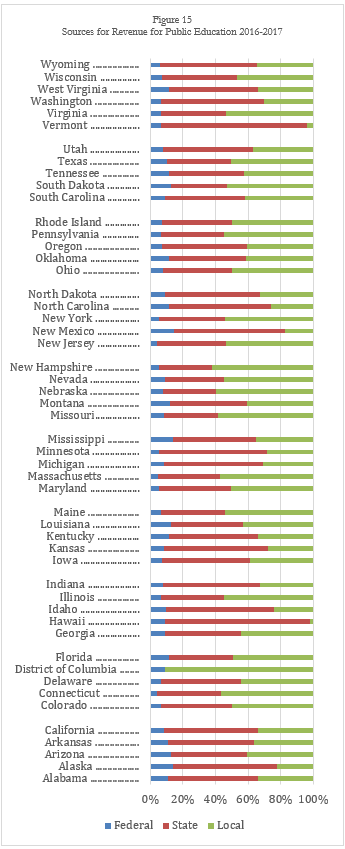
These overall figures mystify the large disparities that exist in public education in the United States. A closer look at per pupil spending across states reveals an entirely different picture. In Figure 13, we can see the various trends displayed by all the states (Ibid). While all states display an increase in per pupil spending over the last 50 years, the degrees by which per pupil spending has increased vary largely across states. Some states have much lower per-pupil spending levels than others. We can also see periodic declines and stagnations at the level of public spending, including one such period since the Great Recession. The main reason for this is the way education is funded in the United States. Unlike many other countries, in the United States, majority of the funding for public schools come from the state and local taxes. Figure 14 shows how US public schools have been funded since 2000 (NCES 2020). A more in depth look at how each state funds their public schools could be found in Figure 15 (Ibid).
Figure 13
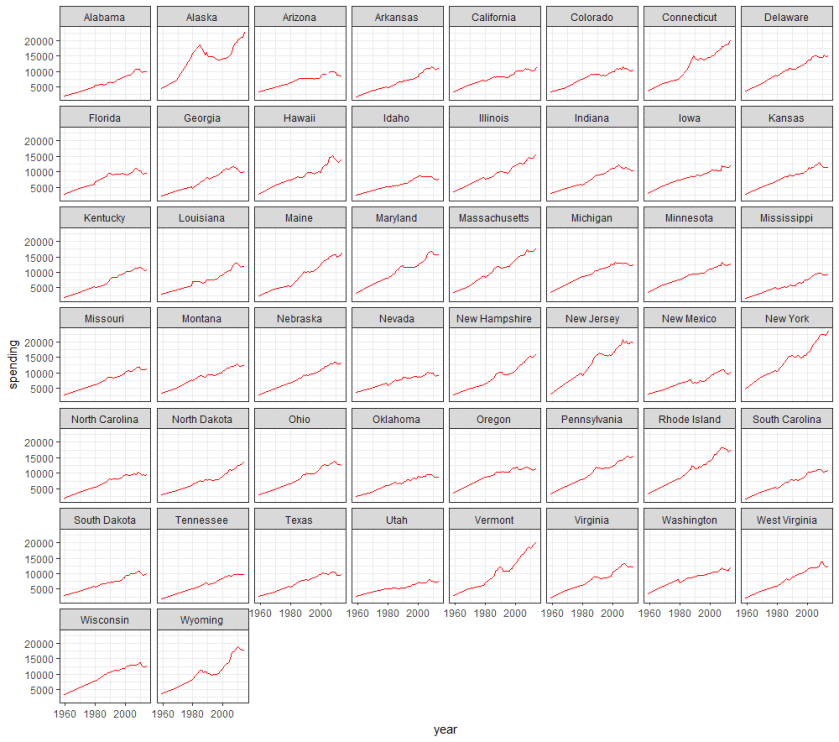 Source: National Education Statistics, Digest of Education Statistics 2016
Figure 14
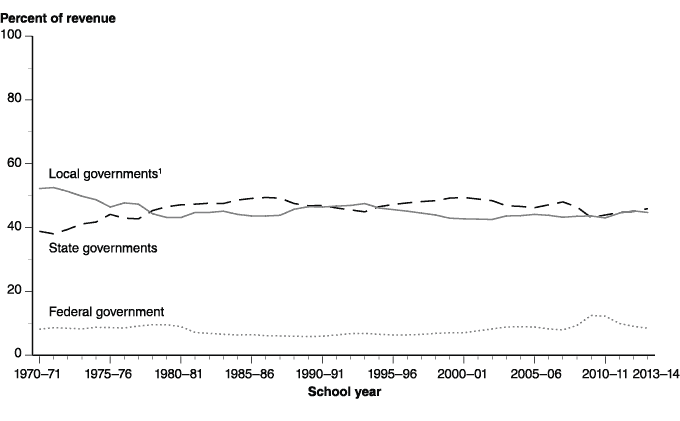 Source: NCES
Source: National Education Association
The overreliance on local and state spending in public education leads to extreme disparities both across and within states. A study by Bruce D. Baker, Mark Weber, Ajay Srikanth, Robert Kim and Michael Atzbi includes the following map which displays the disparities that exist in education spending in the United States (Baker et al. 2018). The map displays the states that are below the required funding levels to reach average national education outcomes in red and those that are above in green. We can observe that the states in the southeast and the southwest are significantly below the required funding levels reach national averages in education outcomes.
Map1: Current spending as % of cost of achieving national average outcomes
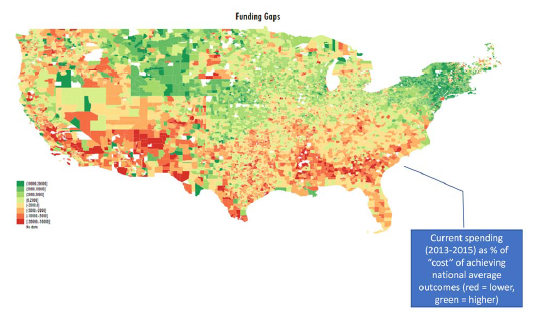
Source: Baker et al(2015)
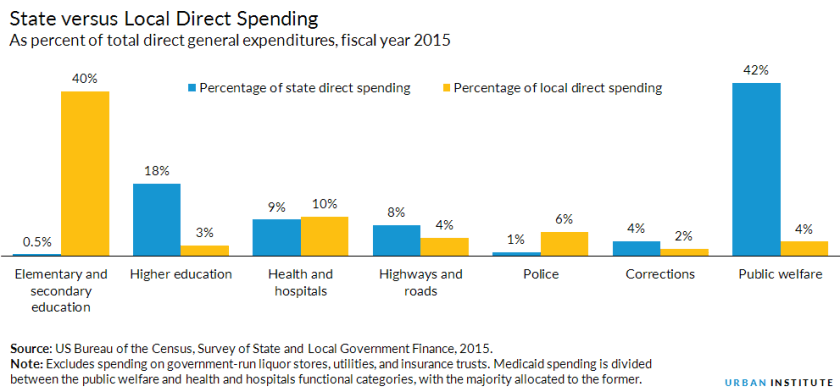
To understand these disparities and relate it to the current crisis, we need to have a closer look at state and local government spending and revenues. A study by the Urban Institute shows how state and local government revenues have been used nationally over time (Urban Institute 2015). We can see in Figure 16 that spending on public education from local and state governments have been declining while spending on public welfare has been increasing at least since the Great Recession. This is partly because of the drastic increases in healthcare costs in the United States as well as the increased dependency on welfare since the Great Recession as the employment rates declined. In Figure 17, we can see that in 2015 only 0.5% of state spending went to K-12 schools while 40% of local government spending went to K-12 schools.
Figure 16

Figure 17
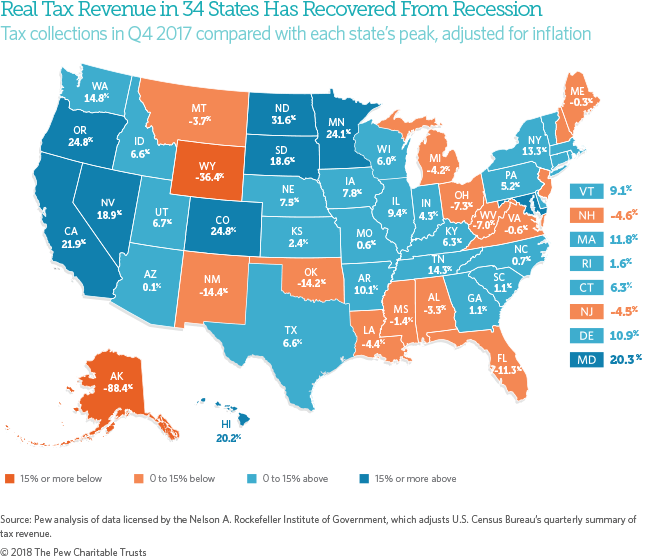
As we have mentioned in the previous section, the Great Recession was a result of the decline in profitability. As profitability declined, state revenues also declined due to lower investments, lower incomes, and lower levels of employment. As of 2017, 16 states are still below the amount of tax revenues they reported prior to the recession (Rosewicz and Newman 2018). Figure 18 shows the tax revenues of states in comparison to their revenues prior to the recession.
Figure 18
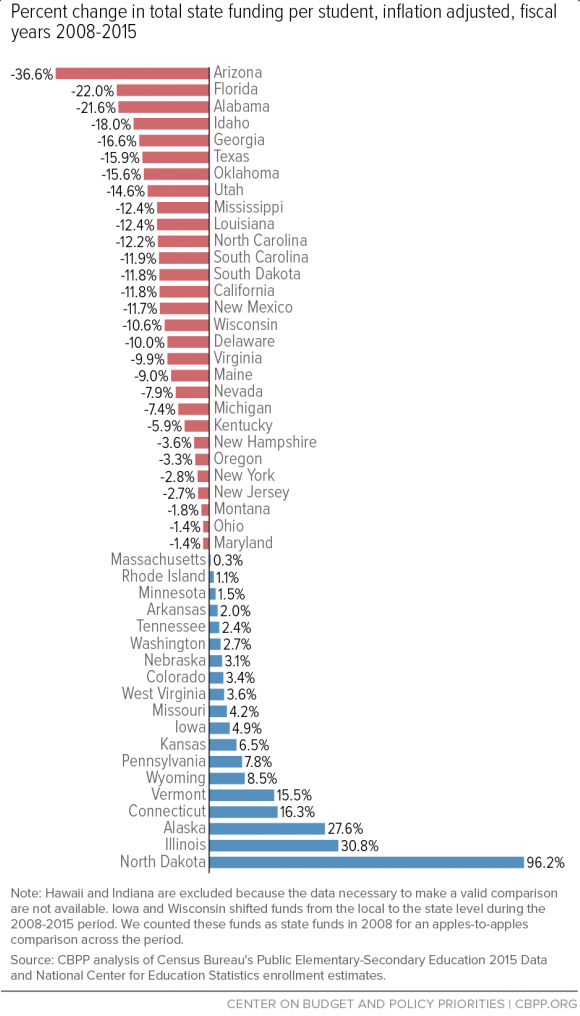
While tax revenues stagnated or declined, healthcare costs were increasing. Because of this and lower levels of employment, more and more people became dependent on Medicaid. Medicaid and CHIP enrollment have increased nationally from 56,533,472 people in 2013 to 73,910,380 in 2018.(Bloom 2017) This was a result of the average health expenses increasing from $7,700 per year in 2007 to $10,345 in 2016. As a result, the amount of state money left to spend on education declined. Figure 19 shows the sharp drop in per pupil state education spending (Leachman, Masterson, and Figueroa 2017a). Figure 20 shows state by state declines in per pupil funding. As we can see Arizona, Oklahoma and Kentucky are among the states whose per pupil spending have declined while West Virginia’s per pupil spending only increased by 3.6% between 2008 and 2015.
Figure 19
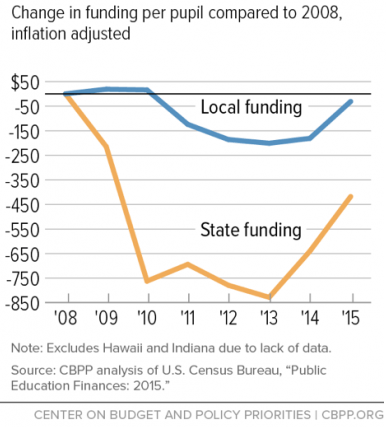
Figure 20
Lower state revenues and higher state costs have pushed state managers to lower in teachers’ salaries and benefits. According to estimates by the National Education Association, adjusted for inflation, average teacher salaries in the United States have declined from $60,778 in 2003 to $58,950 in 2016.(Chang 2018) For the states that have lost large sums of state funding the teacher salaries remain significantly lower than the national average. In Oklahoma teacher salaries went from $45,579 in 2003 to $45,245 in 2016, while in West Virginia they went from $49,999 to $45,701. Teachers in Arizona saw one of the largest drops from $54,396 to $47,403. As of 2015, teachers make 23% less than other college graduates (Allegretto and Mishel 2016). The wage gap between public teachers and similar workers grew from 5.5% in 1979 to 17% in 2015. If we adjust for teachers’ compensation through benefits, this gap remains at 11%. In no state teachers make more than other college graduates. Table 1 shows the ratio of teacher salaries to other college graduate salaries state by state.
Table 1
| State | Ratio | State | Ratio | State | Ratio | State | Ratio | State | Ratio |
| AZ | 62.83% | AL | 71.79% | US | 77.02% | OH | 79.74% | MD | 83.58% |
| CO | 64.54% | TX | 72.80% | ID | 77.33% | IA | 80.00% | DE | 83.68% |
| NC | 65.38% | WA | 73.52% | OR | 77.91% | LA | 80.54% | CA | 85.79% |
| NM | 66.16% | KS | 73.87% | NH | 78.53% | NE | 80.85% | NJ | 86.51% |
| VA | 66.87% | WV | 74.62% | KY | 78.76% | MA | 81.61% | VT | 86.59% |
| OK | 66.98% | FL | 74.64% | IL | 78.97% | CT | 82.05% | PA | 87.05% |
| MO | 67.81% | AR | 74.81% | SC | 79.16% | MN | 82.29% | ND | 88.18% |
| GA | 69.25% | MS | 74.84% | DC | 79.20% | IN | 82.45% | NY | 91.26% |
| UT | 70.31% | HI | 76.36% | NV | 79.37% | WI | 82.55% | MT | 91.66% |
| TN | 70.69% | SD | 76.38% | ME | 79.72% | MI | 82.69% | AK | 93.84% |
| RI | 95.77% | ||||||||
| WY | 98.62% |
So far, we have shown that because of the drop in the rate of profit there have been lower levels of investments. The lower levels of investments made state budgets shrink significantly. Because of this, states cut their spending in K-12 public education. This led to a decline in per pupil spending and sped up the decline that was already taking place in teachers’ salaries. As we can see, under the cases of external economic pressure, state actors are forced, and do not hesitate to remove what are essential services for working class people. But some states went even further. To recover profitability in their states, 7 of the 12 states with the most significant drops in K-12 spending have also lowered their individual or corporate tax rates.(Leachman et al. 2017a) North Carolina reduced their top marginal individual tax rate by 1.95%, while teachers’ salaries declined from $56,174 in 2003 to $49,837 in 2016 and as their per pupil state spending declined by 12.2% between 2008 and 2018. Kansas reduced theirs by 1.65% (Tax Foundation.org 2013), while teachers’ salaries declined by $4,272 between 2009 and 2016. Figure 21 shows the states that have also cut taxes while their schools were already receiving less funding then before.(Leachman et al. 2017a)
Figure 21

The goal of this section has been to provide empirical evidence for the state actions that have led to decreasing public education quality and teachers’ salaries. Since the recession, most states have lower spending dedicated to public schools. This was a result of state actors’ decision to cut public spending – and in some states even cut taxes, to recover profitability in their states. Cuts in public spending and taxes became standard tactics among policy makers since the 1980s, and the policies that have followed the Great Recession have only been a new wave of this trend. As a result, jobs in education have declined by 135,000 and capital spending in K-12 public schools are more than 25% lower than their 2008 levels, while student enrollment increased by 1,419,000 between 2008 and 2017 (Ibid). In short, the rate of exploitation increased significantly in public schools as teachers had to educate a larger number of students with a smaller quantity of resources. In the next section, we will explore the process of radicalization among teachers in the face of these circumstances.
Teacher Revolts: Then and Now
Although it might be surprising based on what we discussed so far, throughout the early twentieth century teaching was considered a ‘profession’, almost on par with law and medicine in terms of its social status (Cole 1969). For this reason, the organizations of teachers like the National Education Association and the American Federation of Teachers modeled themselves after the likes of the American Bar Association and American Medical Association. NEA opposed the unionization of teachers, and both NEA and AFT had no-strike policies until the 1960s as they believed this would degrade the teaching profession. Hence the earlier waves of unionization and protests among teachers were driven largely by the attempts to maintain or expand the professional integrity of the profession. Because of this millions of teachers, most of whom taught in public schools, were excluded from the collective bargaining provisions of NLRA alongside the rest of the public sector workers as teachers largely sat out the strike waves of the 1930s (Shelton 2017:6).
Until the late-1950s-early-1960s, there was little strike activity among teachers with the exception of a handful of communist led locals during the Great Depression(Ibid:11-12), and a few AFL-Locals in mid-1940s before Taft-Hartley as teacher wages declined in the face of post-war inflation (Cole 1969: 14). Up to this point, American Federation of Teachers was largely left alone by the national AFL leadership, as the AFT was perceived to be more of a professional association. Meanwhile the NEA maintained its commitment to opposing strikes while it remained the largest teacher’s union in the country. However, a wave of strikes that began with the New York night schoolteachers strike in 1959 pushed for collective bargaining rights among public school teachers and helped change the no-strike stance of prominent teacher unions. As these strikes spread and began winning collective bargaining rights, and as AFL membership declined in the late 1950s as the number of factory workers declined due to automation (Ibid: 165), the AFL leadership began to view organizing teachers as a way of increasing union membership among the largely non-union white collar labor force. Hence, the AFL began to aid these efforts among teachers which also challenged the NEA’s no strike position. However, during this period, most state school boards used a ‘carrot-and-stick’ approach where the legal recognition of collective bargaining rights came alongside no-strike laws (Shelton 7).
Even as it was illegal for most public-school teachers to go on strike, another wave of strikes emerged in the middle of the 1972-75 in reaction the ‘budget crisis’ created by the stagflation crisis. After the crisis,
The decimated tax base, continued loss of jobs, and movement of wealth to the suburbs combined with economic downturn and the higher salaries of city teachers in the collective bargaining era to create massive budget shortfalls. During the late 1960s, banking interests had been willing to cover deficits with credit, but in the 1970s they increasingly moved to discipline cities with austerity budgets that hurt both public employees and the urban citizens who both relied on those services and had been critical of the subpar versions that had existed before fiscal crisis. (Ibid: 12)
Both the fiscal crisis of the 1970s and that of 2010s were caused by the same dynamic of declining profitability and ‘business confidence’ which lowered tax revenues in certain localities. Similarly, in both cases the economic burden of the budget shortfall was shifted onto the shoulders of public sector employees by their state managers, rather than the capitalists. The main difference between the two waves of strikes is that the strikes began in the newly unionized urban school districts in the 1970s which were hit the hardest due to the racialized nature of the budget cuts, but they started in more rural southern states in the strike wave that began in 2018 (although as I mentioned in the introduction, the strikes did eventually move to large urban areas within the span of a few months).
The teachers’ demands in the mid-1970s strike wave were concerned with inflation wage-adjustments, layoffs, and class sizes. In Philadelphia, where the wave started in 1972:
The board of education’s contract offer in August 1972 seemed certain to provoke a strike. In addition to freezing salaries, the proposal extended the teaching day and eliminated over 500 jobs. Not only did teachers oppose the cuts, but they also asked for enough new positions to reduce class sizes and a 34 percent salary increase for all teachers to offset the 7 percent inflation since the last contract and the expectation of higher inflation when Nixon lifted price controls. (Ibid: 84)
In January 1973, after the second strike of Philadelphia teachers since August 1972, Chicago teachers went on strike. “The CTU initially demanded a 10 percent pay increase but quickly scaled it down to 2.5 percent; the salary increase was not as important as averting the layoffs and larger class sizes” (Ibid 101). In St. Louis,
… by 1972, a skilled union craftsman without a high school education working for the school district began with an annual salary that was $3,000 higher than a first-year teacher. Teachers believed that their level of education and social status entitled them to be paid on par with or better than blue-collar workers. Without exclusive representation, two unions competed for the city’s teachers—the slightly larger STLTU (Local 420) and the St. Louis Teachers Association (SLTA–NEA). (Ibid: 105)
Around the same time as the Chicago strike “the two sides joined forces, threatening a strike the next January unless the school board agreed to a collective-bargaining election, hospitalization insurance, and a “substantial” midyear raise” (Ibid). Out of these strikes, only St. Louis teachers did not have the legal recognition for collective bargaining, however, the strikes would eventually spread to Detroit and New York where the teachers also did not have the legal right to strike.
By the 2010s the working conditions and the quality of educational resources had deteriorated to obscene levels in parts of the country as we described in the previous section. Alongside wage demands, the teachers had to fight for additional funding for the needs of their students. “Between 2008 and 2017, per-pupil instructional funding was cut by 28 percent in Oklahoma and 14 percent in Arizona, ranking them as the forty-sixth and forty-ninth lowest-funded states in 2017” (Blanc 2019) In spring 2018,
Due to budget cuts, many districts in Arizona and Oklahoma have been forced to reduce the school week to four days… Class sizes are often enormous, while textbooks are scarce and scandalously out of date. Innumerable arts, language, and sports programs have been eliminated. Broken desks, crumbling ceilings, chair shortages, and rodent infestations have become normal. (Ibid)
Because of this funding demands for students were as central for striking teachers in Oklahoma and Arizona as wage demands. Similarly, for West Virginia teachers, salary demands were also secondary as “the movement arose primarily in response to proposed changes to the state’s public health insurance plan, the Public Employees Insurance Agency (PEIA)” (Ibid). As we mentioned in the last section, in the last decade the rising health care expenses became a major part cost on states, hence also a major target for austerity budgets. As the strikes moved to blue states, the demands included assistance for homeless students in Chicago (Maass 2019), and “ending punitive disciplinary procedures that feed the “school to prison pipeline” and do nothing to improve school climate, essential for safe schools” in LA (Weiner 2019).
It is important to note that the strikes in West Virginia, Oklahoma and Arizona were all illegal. Although the initial wave of strikes in the 1960s, before the teachers gained collective bargaining rights were illegal as well, these strikes took place in a completely different atmosphere where strikes and union activity were widespread across the country (Shierholz and Poydock 2020). On the other hand, when West Virginia teachers went on strike in April 2018, the South had been marked by the weakness of organized labor and the labor movement had been on retreat for decades. As Eric Blanc puts it:
To the surprise of all, this frontal challenge to austerity and neoliberalism came in the form of illegal statewide strikes in Republican “right to work” bastions. Since unions in these states were relatively weak and collective bargaining virtually nonexistent, the strikes took on an unusually volcanic and unruly form. In an unprecedented historical development, much of the organizing for these actions took place in secret Facebook groups where teachers could share their fears, hopes, personal stories, and action proposals (as well as countless silly memes). And with union officials reluctant to call for illegal mass action, rank and filers stepped into the leadership vacuum and filled it to the best of their abilities. (Ibid)
The uniqueness of the ‘Red State Revolt’ was not limited to this. The bottom-up model of organizing, largely driven by the rank and file created a more democratic environment where the rank and file could bypass the hesitant union leadership through the strong social bonds that existed between them. As Blanc states;
Organizers and rank and filers endlessly insisted that it was only by coming together across their myriad of divides that school employees could achieve their demands. The names of the Facebook organizing groups that launched the walkouts are indicative: West Virginia Public Employees United, Oklahoma Teachers United (OTU), and Arizona Educators United (AEU). In West Virginia, the page quickly became known simply as United. This consistent emphasis reflects a basic fact about labor struggles under capitalism: namely, that as atomized individuals, workers are virtually powerless at work. Only by joining together with our coworkers in common organizations and actions are we able to assert ourselves against management.
As these strikes were largely successful in winning many of their demands, they also prove Block’s point about state’s behavior. The important lesson from both the case of the 1960s-70s and the current wave of teacher strikes is that the state is structurally inclined to pursue the interests of the capitalists by pursuing austerity in the times of crisis in order to recover ‘business confidence’. In both cases, however, the active resistance of the working class is the only way to stop the imposition of austerity, and to better the conditions of the working-class. Throughout the neoliberal era, public sector unions have been hesitant to go on strike as the tides turned against them both legally and politically (Shelton 2017:192-93). However, the successes of the striking teachers in 2018-19 could mark a turning as more workers organize for power from the bottom up and counter the structural tendencies of capitalism and the state. A democratic workers movement still carries the most promising alternative to politics of neoliberal austerity.
Conclusions
Unless we follow the example of striking teachers, the states will continue to starve public schools and teachers and as a result the quality of education will continue to decline. This paper discussed the decline in public schools through explaining their relation to the state and the capitalist system. The first section has focused on theories of the state and elaborated the political and economic constraints under which state managers act. The second section explained the concept of profitability and the neoliberal policies the state actors followed to recover profitability after the stagflation crisis of the 1970s. The third section explained the effects of falling profitability and investments on state budgets and empirically showed the cuts in state funding for public education that were caused by these factors. It has also shown that the low-tax and low-spending neoliberal orthodoxy that was established following the stagflation crisis continued to influence policies in some of the states with largest cuts in public education. The final section briefly discussed the history of public sector teacher strikes during the stagflation crisis and since the Great Recession. To conclude I argue that unless class struggle in public education continues to surge, we can expect to see the continuation of similar policies as profitability continues to decline and state actors continue to pursue neoliberal policies.
[1] See (Goldfield and Melcher 2019) for a critique of state autonomist interpretation of New Deal historiography.
Bibliography
Allegretto, Sylvia A., Sean P. Corcoran, and Lawrence R. Mishel. 2008. The Teaching Penalty: Teacher Pay Losing Ground. Washington, D.C.: Economic Policy Institute.
Allegretto, Sylvia A., and Lawrence Mishel. 2016. “The Teacher Pay Gap Is Wider than Ever: Teachers’ Pay Continues to Fall Further behind Pay of Comparable Workers.” Economic Policy Institute. Retrieved November 21, 2018 (https://www.epi.org/publication/the-teacher-pay-gap-is-wider-than-ever-teachers-pay-continues-to-fall-further-behind-pay-of-comparable-workers/).
Baker, Bruce, Mark Weber, Ajay Srikanth, Robert Kim, and Michael Atzbi. 2018. “The Real Shame of the Nation The Causes and Consequences of Interstate Inequity in Public School Investments.”
Blanc, E. 2019. Red State Revolt: The Teachers’ Strike Wave and Working-Class Politics. Verso Books.
Block, Fred, ed. 1987. “The Ruling Class Does Not Rule:: Notes on the Marxist Theory of the State.” Pp. 51–68 in Revising State Theory, Essays in Politics and Postindustrialism. Temple University Press.
Bloom, Ester. 2017. “Here’s How Much the Average American Spends on Health Care.” Retrieved November 21, 2018 (https://www.cnbc.com/2017/06/23/heres-how-much-the-average-american-spends-on-health-care.html).
Chang, Alvin. 2018. “Your State’s Teachers Are Underpaid. Find out by How Much.” Vox. Retrieved November 21, 2018 (https://www.vox.com/policy-and-politics/2018/3/9/17100404/teacher-pay-salary-underpaid-database).
Charter School Growth Fund. 2017. “Funders.” Charter School Growth Fund. Retrieved November 21, 2018 (https://chartergrowthfund.org/our-people/funders/).
Cole, S. 1969. The Unionization of Teachers: A Case Study of the UFT. Praeger.
DiMaggio, Dan, and Joe DeManuelle-Hall. 2019. “2019 Year in Review: Workers Strike Back.” Labor Notes. Retrieved May 17, 2020 (https://www.labornotes.org/2019/12/2019-year-review-workers-strike-back).
Elk, Mike. 2018a. “‘Arab Spring for Teachers’: Educators in Oklahoma Join Wave of Strikes.” The Guardian, April 4.
Elk, Mike. 2018b. “West Virginia Teachers Stage Walkout over Wages and Benefits.” The Guardian, February 22.
Frankel, Jeffrey. 2017. “How the GOP Tax Overhaul Compares to the Reagan-Era Tax Bills.” PBS NewsHour. Retrieved November 21, 2018 (https://www.pbs.org/newshour/economy/making-sense/how-the-gop-tax-overhaul-compares-to-the-reagan-era-tax-bills).
Goldfield, Michael, and Cody R. Melcher. 2019. “The Myth of Section 7(a): Worker Militancy, Progressive Labor Legislation, and the Coal Miners.” Labor 16(4):49–65.
Leachman, Michael, Kathleen Masterson, and Eric Figueroa. 2017. “A Punishing Decade for School Funding.” Center on Budget and Policy Priorities. Retrieved November 21, 2018 (https://www.cbpp.org/research/state-budget-and-tax/a-punishing-decade-for-school-funding).
Maass, Alan. 2019. “In Striking, Chicago Teachers Went on the Offense for Public Schools.” Jacobin. Retrieved May 18, 2020 (https://jacobinmag.com/2019/11/chicago-teachers-union-strike-contract-lori-lightfoot-2).
Marx, Karl. 1888. “Communist Manifesto.” Retrieved May 18, 2019 (https://www.marxists.org/archive/marx/works/1848/communist-manifesto/ch01.htm#007).
McLaren, Mandy, and Darcy Costello. 2018. “New Wave of School Closures? Kentucky Teachers Union Calls for a ‘day of Action’ on Friday.” The Courier-Journal. Retrieved November 21, 2018 (https://www.courier-journal.com/story/news/education/2018/04/10/kentucky-teachers-union-calls-return-frankfort/501101002/).
Miliband, R. 1969. The State in Capitalist Society. Basic Books.
NCES. 2020. “The Condition of Education – Preprimary, Elementary, and Secondary Education – Finances – Public School Revenue Sources – Indicator April (2020).” Retrieved May 18, 2020 (https://nces.ed.gov/programs/coe/indicator_cma.asp).
NEA. 2016. “Digest of Education Statistics-Digest of Education Statistics – Home.” Retrieved May 18, 2020 (https://nces.ed.gov/programs/digest/).
OECD. 2019. “Education Resources – Education Spending – OECD Data.” TheOECD. Retrieved May 18, 2020 (http://data.oecd.org/eduresource/education-spending.htm).
Poulantzas, Nicos. 1969. “The Problem of the Capitalist State.” New Left Review 0(58):67.
Press, Associated. 2018. “West Virginia Teachers’ Strike Ends as Lawmakers Accept Pay Demands.” The Guardian, March 6.
Rosewicz, Barb, and Daniel Newman. 2018. “Decade After Recession Began, Tax Revenue Higher in 34 States.” Retrieved November 21, 2018 (https://www.pewtrusts.org/en/research-and-analysis/articles/2018/05/02/decade-after-recession-began-tax-revenue-higher-in-34-states).
Shaikh, Anwar. 1978. “An Introduction to the History of Crisis Theories.” URPE: US Capitalism in Crisis.
Shaikh, Anwar. 2011. “The First Great Depression of the 21st Century.” Socialist Register (47):44–63.
SHELTON, JON. 2017. Teacher Strike! University of Illinois Press.
Shierholz, Heidi, and Margaret Poydock. 2020. “Continued Surge in Strike Activity Signals Worker Dissatisfaction with Wage Growth.” Economic Policy Institute. Retrieved May 8, 2020 (https://www.epi.org/publication/continued-surge-in-strike-activity/).
Skocpol, Theda. 2016. “Political Response to Capitalist Crisis: Neo-Marxist Theories of the State and the Case of the New Deal:” Politics & Society.
Stiglitz, Joseph E. 2015. Towards a General Theory of Deep Downturns. Working Paper. 21444. National Bureau of Economic Research.
Tax Foundation.org. 2013. “State Individual Income Tax Rates, 2000-2014.” Tax Foundation. Retrieved November 21, 2018 (https://taxfoundation.org/state-individual-income-tax-rates/).
Trading Economics. 2020a. “United States Federal Corporate Tax Rate | 1909-2020 Data | 2021-2022 Forecast.” Retrieved May 18, 2020 (https://tradingeconomics.com/united-states/corporate-tax-rate).
Trading Economics. 2020b. “United States Government Debt | 1942-2020 Data | 2021-2022 Forecast | Historical.” Retrieved May 18, 2020 (https://tradingeconomics.com/united-states/government-debt).
Urban Institute. 2015. “State and Local Expenditures.” Urban Institute. Retrieved November 21, 2018 (https://www.urban.org/policy-centers/cross-center-initiatives/state-local-finance-initiative/projects/state-and-local-backgrounders/state-and-local-expenditures).
Weiner, Louis. 2019. “Why the LA Teachers Strike Matters.” Jacobin. Retrieved May 18, 2020 (https://jacobinmag.com/2019/01/utla-los-angeles-teachers-strike-privatization).
